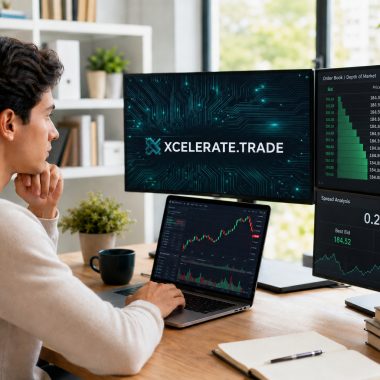

I would rather sit down to a chart with clear rules than a folder of trades I wish I had taken. A screenshot can make a move look obvious once it is over. What interests me is the decision that was possible before the next candle appeared, when the outcome was still uncertain. A candle summarizes price movement during a chosen period, including its opening and closing prices.
A trading playbook records the conditions for taking a trade and the rules for managing its risk. To build one with Xcelerate Trade, I would translate a strategy lesson into observable entry and exit conditions, then test those rules and keep a record of the results before considering live execution.
What is a trading playbook?
A trading playbook is a written reference for deciding when a trade qualifies and how it will be managed. A setup is the combination of market conditions and signals required before I consider a trade. A broader playbook can contain several setups, each with its own rules and examples. I think of each setup page as a decision guide that another person should be able to follow without guessing what I meant.
A rule such as enter when price looks strong leaves an uncomfortable amount of room for interpretation. I would name the observable evidence required before entry and the timeframe, meaning the period represented by each candle. Invalidation means the condition that makes the proposed setup no longer eligible.
I also distinguish a playbook from a trading plan and a trading journal. My trading plan would govern the account and working routine, while the playbook would describe individual setups. The journal would record what actually happened, including the difference between the written rules and my behavior.
These documents can live in the same notebook or spreadsheet. I do not need separate software subscriptions to give them separate jobs. What matters is being able to trace a trade back to the setup and rule version that justified it.
How can Xcelerate Trade help with the first version?
Xcelerate Trade describes its main website as a discovery hub connecting visitors to Academy lessons and strategy guides on its learning platform, where chart tools are also available. Its public guidance encourages practicing with simulated money in a demo account and recording observations in a journal. I would use those resources as inputs for a personal playbook, then keep my own records of how each rule performs.
If I wanted to learn online tested strategies, I would use the lessons as a starting point and examine the evidence behind each method. I would look for the exact rules and market studied, together with the costs assumed in the results. I would also check whether those results came from historical simulation or actual execution before deciding what to test myself.
I would open one relevant lesson and translate its conditions into plain English. Anything I could not define would need checking before I continued. Then I would practice recognizing those conditions on charts before adding another topic. If I still need to reinterpret a rule every time I see it, the first version is not ready for meaningful testing.
My working document could be a simple text file with dated revisions. I would store chart examples beside it and maintain a spreadsheet for the trade record. I would use Xcelerate.Trade for the educational material and keep this working record in my own files.
Start with a market and a session you can actually study
The market and session in a trading playbook need to fit the hours I can observe consistently. A setup that forms during a session I cannot watch is a poor match for my routine, however attractive its historical charts look. Trading around work, family responsibilities, or unreliable internet changes what is practical.
I would name the precise instrument and data source in the playbook. I would avoid transferring results between products without checking their specifications. Position value and execution costs still need separate attention even when two charts look similar.
Session times need the same care. I would record the relevant market timezone and verify how my chart displays it, particularly around daylight saving changes. A rule tied to the New York cash open should not silently shift because I wrote down a local clock time months earlier.
I would also separate the context chart from the execution chart. For example, an illustrative playbook might use an hourly chart for background and a five-minute chart for entry decisions. Neither timeframe becomes useful merely because I picked it; the combination needs a clear purpose and consistent testing.
Why start with a single setup?
I would begin with one setup because I want the early evidence to mean something. If I combine unrelated methods in the same sample, a profitable total tells me very little about any individual method. Keeping the setups separate would let me see which rules produced each result.
An opening range breakout, usually shortened to ORB, provides a concrete example. The opening range is the high and low established during a defined opening window, and a breakout occurs when price moves beyond that boundary. The trading method then needs additional rules explaining whether, when, and how that move becomes tradable.
Xcelerate.Trade’s public ORB materials describe waiting for the opening range to finish, followed by a breakout confirmed using trading volume. Volume measures trading activity in the chosen data feed. The method then requires a retest, meaning a return to the broken boundary, and rejection, meaning price behavior that meets the rule for moving away from that boundary again.
The numerical settings below are illustrative choices for a hypothetical study. They are not recommended parameters or the platform’s default configuration. I would record the settings separately so I could compare the study with the original lesson.
Turn the setup into conditions I can observe
Observable setup rules specify when the opening range becomes fixed and what must happen afterward. If my hypothetical study used the first fifteen minutes of a session, I would not count a temporary break during those fifteen minutes as a breakout of the completed range. The boundary is still changing until the window closes.
I would define whether the breakout requires a candle close beyond the boundary and specify the chart used to judge it. For volume confirmation, I would record the exact calculation and data feed. A volume rule tested on one feed would need checking before I applied it to another.
The retest rule would specify a permitted distance from the boundary and an expiry time. If price returns after that deadline, the setup no longer qualifies. Without those limits, I could stretch the meaning of retest until nearly any later movement appeared to qualify.
Rejection is another word I would not leave hanging. For a long setup, meaning a trade intended to benefit from a price increase, an illustrative rule might require the retest candle to touch the zone and close above it. Entry would still depend on a separately specified trigger. That is a testable proposal, not evidence that this particular trigger works.
I would then try to find two people who could mark the same chart independently. If they repeatedly disagree about whether the conditions occurred, I would examine the wording before trusting the statistics. A method can involve judgment, but I still need to know where that judgment enters the process.
Write the reasons to stay out
No-trade rules define the conditions that disqualify an otherwise recognizable setup. It is easy to write about ideal conditions and much harder to admit that a familiar pattern can appear in an unsuitable setting. I want the rejection rules close enough to the entry rules that I cannot conveniently overlook them.
For my hypothetical ORB study, I would investigate whether unusually narrow or wide opening ranges deserve exclusion. I would also define what happens when a retest arrives too late or the required confirmation never appears. These conditions would be fixed before the next test, rather than invented to explain a losing chart afterward.
Scheduled economic announcements deserve a written policy too. I would specify the calendar source and any excluded time window, then record whether the filter was applied consistently. Skipping a release may reduce exposure to abrupt movement, but it does not make the surrounding session predictable.
There is a personal side to staying out as well. If I am unable to monitor an open position or I have already reached my session limit, the chart does not override that fact. I would write those restrictions into the account plan and reference them from every setup page.
Calculate position size after defining the stop
Position sizing means choosing how many units to trade based on the amount at risk. I would calculate that size after defining the stop, the intended exit level if price moves against the position. A setup can look convincing and still require a position that is unsuitable for the account. The amount I am willing to lose cannot be whatever remains after I choose the size I would like to trade.
Consider a hypothetical account of $10,000 with a planned risk allowance of $50 per trade. If the chosen instrument loses $1 per point per unit and the entry is twenty points from the stop, one unit carries $20 of price risk before costs. Two units would carry $40, while three would carry $60 and already exceed that allowance.
The arithmetic becomes useful only after I check the actual contract specifications. The spread is the difference between the available buying and selling prices, while slippage is the difference between an expected and actual execution price. I would allow for those costs and any fees when calculating the size that fits the budget. If the smallest available position is too large, I would skip the trade or study a more suitable product.
Investor.gov, the investor education website of the U.S. Securities and Exchange Commission, explains that a stock stop order does not guarantee execution at the stop price. I would check the order terms for my chosen product and allow for an execution price beyond the intended level. I would describe $50 as planned risk in this example, rather than pretend it is an absolute ceiling under every condition.
I would set a session stopping rule separately. A hypothetical limit could halt trading after two full planned losses, but I would account for realized costs and open exposure when assessing the account. The exact limit needs to suit the account and method; the purpose is to decide it before frustration starts negotiating.
Decide how the trade ends before it begins
An exit policy specifies the initial stop and the conditions for taking profit or closing an unfinished trade. I would write those conditions before testing the setup. If I allow discretionary intervention, I would define its boundaries and record each use.
I find it useful to express outcomes in R, where one R is the initial planned price risk on a trade. If that risk is $50, a $100 gain before costs is plus 2R, while a $50 loss is minus 1R. For consistent analysis, I would state whether the journal reports gross R or net R after trading costs.
A target of 2R describes a proposed reward relative to risk; it does not tell me how often the target will be reached. Moving a target farther away may change the win rate, meaning the proportion of profitable trades. I would also check whether trades stay open longer. I would evaluate those effects together rather than choose the ratio with the nicest appearance.
Moving a stop to entry also needs evidence. It can reduce some losses while closing other trades during an ordinary pullback, and the entry price may still leave a small net loss after costs. I would test that management rule as a separate variation instead of assuming the word breakeven makes it harmless.
Backtest the written rules without borrowing tomorrow’s information
Backtesting means applying a fixed set of rules to historical market data to examine how it would have behaved. I would begin with chart replay, which reveals historical price movement progressively, if the method contains visual decisions that need clarification. The aim would be to practice making each decision with only the information available at that moment.
I would record every eligible setup in a defined period, including the awkward ones. Selecting only memorable examples would distort the sample before the calculations even started. I would also record skipped opportunities, because a filter that removes winners as well as losers changes the method’s overall behavior.
The treatment of candle data deserves care. If a historical candle touches both the stop and target, its high and low alone may not reveal which was reached first. I would use more detailed data where available or apply a documented conservative assumption, rather than award myself the favorable sequence.
Look-ahead bias occurs when a historical test uses information that was unavailable at the decision point. Repainting means a script can display past signals differently after recalculation or as data changes. TradingView documents both problems, so I would check that a historical marker was actually available in that form during the session.
I would separate the period used to develop the rules from a later period reserved for evaluation. If I keep adjusting parameters after inspecting that later period, I have effectively used it for development too. Fresh data then becomes necessary for another meaningful check.
There is no universal trade count that certifies a strategy. Clustered trades from similar conditions can offer less independent evidence than the total suggests. I would want the sample to cover different market conditions and would describe its limits alongside the results.
What do the trading results actually tell me?
Win rate tells me how often trades were profitable under the chosen definition. It says little about the size of those profits relative to the losses. A method that wins frequently can still lose money if its occasional losses are sufficiently large.
Suppose a hypothetical test produces forty wins averaging plus 2R and sixty losses averaging minus 1R. The gross result is plus 20R across one hundred trades, equivalent to an average of plus 0.2R per trade before costs. Expectancy is the average result per trade under the tested assumptions. The arithmetic does not predict that a future hundred trades will behave the same way.
Drawdown is the decline in account value from a previous peak. I would examine that decline and check how much of the total profit came from a handful of trades. I would also check whether costs consume a large share of the apparent edge. A small positive average can be fragile when assumptions about fills are optimistic.
Rule adherence belongs beside those financial results. If I followed the setup on only part of the sample, I need to separate the model’s trades from my deviations. Otherwise, I cannot tell whether the rules need revision or whether I have not yet evaluated them consistently.
Forward test before considering live money
Forward testing applies the documented method as new market data arrives. In a demo environment, I can examine whether I recognize the setup in time and whether the routine fits my day. I would record missed entries as well as completed trades to see whether the routine is practical.
I would compare forward results with the historical assumptions without expecting an immediate match. Short samples vary, and market conditions change. I would first check whether the forward test uses the same rules and execution assumptions as the historical test.
Demo execution may differ from live execution. Liquidity, meaning the availability of orders to trade against, can affect actual fills, and simulated trading does not expose personal money to loss. If I later chose to trade live, I would set small exposure limits and stopping criteria for that separate stage.
Keep chart tools in a supporting role
Xcelerate Trade’s public ORB indicator page distinguishes identifying the range and breakout from deciding whether a complete trade setup exists. An indicator is a chart tool that calculates or marks information from market data. A visual marker can draw my attention to a condition while I still need to check the remaining entry requirements and calculate position size.
I would document each tool’s settings and the role it serves. If I change the session window, volume input, or another parameter, I would record the change with the playbook version. Otherwise, a chart from last month could appear to support rules that were never actually used together.
I would also resist adding an indicator merely because a recent losing trade looked avoidable in hindsight. Another filter changes the eligible sample and may remove profitable trades as well. Before keeping it, I would need a clear rationale and a fresh comparison that accounts for the additional complexity.
Review the playbook without rewriting it after every loss
A playbook review checks whether each trade qualified under the rules available before entry. A valid setup can lose, and an impulsive trade can make money. If I reward only the outcome, I risk teaching myself to repeat the wrong behavior.
For each trade, I would save a chart showing the decision point and write a short explanation of the action taken. The note would include any deviation, such as entering before confirmation or increasing size after a loss. Plain descriptions are more useful than a long story about what the market should have done.
At a scheduled review, I would look for repeated issues across a group of observations. If a rule needs changing, I would explain why in a new version. That version would need a separate test. I would keep the original record intact so the apparent history does not improve every time I edit the method.
I would also allow for the possibility that the strategy should be paused or abandoned. Continued weak evidence is not an obligation to keep refining it indefinitely. Time spent studying a method can improve my understanding without making the method suitable for live use.
Keeping a usable version beside the chart
A usable playbook should let me explain the setup before the outcome is known. I should be able to identify its market and explain why an entry qualifies. I also need to know the intended financial exposure and what would cancel or end the trade. When something remains discretionary, the document should say so openly.
I would measure progress by clearer decisions and more consistent records. Trading still carries the possibility of loss, even when the document is careful and the execution follows it.
I would keep the current version beside the chart, with older versions stored separately. When a rule changes, its effective date belongs in the record. That lets me review a trade against the instructions I actually had that day.
Frequently asked questions
Can I use someone else’s playbook without changing it?
A borrowed playbook can provide rules to study, but its assumptions still need to match the product and data feed you use. I would first reproduce the method as written and record any mismatch. Changes should be documented and tested separately so results remain attributable to a specific version.
What should I record when a valid trade is missed?
A missed valid trade belongs in the journal with its qualifying conditions and the reason no order was placed. I would distinguish being unavailable from hesitating while watching the setup. Those records help reveal whether the difficulty lies in the schedule or in applying the rules.
Can the same playbook cover long and short trades?
A playbook can cover both directions if it defines each explicitly. A short trade aims to benefit from falling prices, but the product’s order rules and costs still need checking. I would record the results for each direction separately before assuming the rules behave symmetrically.
How should screenshots be stored for later review?
Each screenshot would carry a timestamp and identify the instrument. I would also label it with the playbook version. A chart saved at the decision point preserves what was visible before the result; a later chart can show how the trade developed. Keeping both avoids relying entirely on an image that makes the outcome look obvious.